
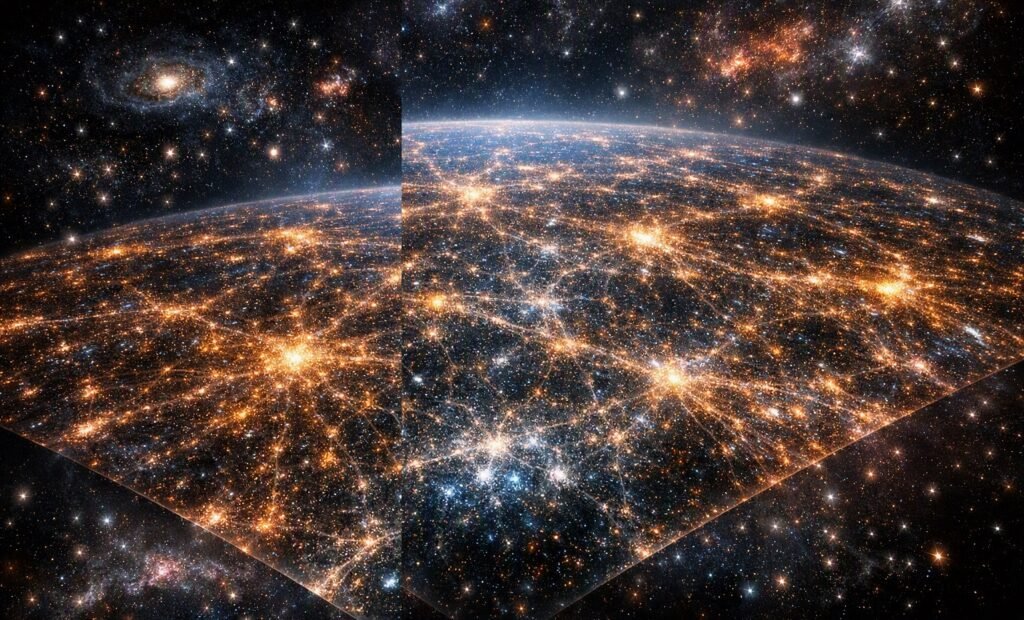
Universe 2D map: the extraordinary cosmic chart revealing 4 billion celestial objects
Universe 2D map is becoming one of the most extraordinary achievements in modern astronomy, revealing nearly four billion celestial objects across a colossal mosaic of 5.6 trillion pixels.
There is something almost paradoxical about the new map of the Universe released by astronomers: to represent an enormous portion of the cosmos, scientists had to spend years staring at the sky, collecting hundreds of thousands of images and entrusting a gigantic volume of data to one of the most powerful scientific supercomputers available. The result is a two‑dimensional map composed of 5.6 trillion pixels, containing nearly four billion celestial objects—mostly stars and galaxies. But behind that colossal image lies far more than a photograph. It is a new gateway for exploring the cosmos and building increasingly precise three‑dimensional maps.
The new map was published on August 10, 2026, by the team behind the DESI Legacy Imaging Surveys, the massive observational program that provided the foundation for the DESI project. It covers roughly 75% of the sky in visible and near‑infrared wavelengths. Yet perhaps the most important number is not the pixel count. The truly fascinating aspect is that this enormous sky chart represents one of the essential steps toward something even more ambitious: a three‑dimensional map of the Universe, one that shows not only where a galaxy appears in the sky, but also how far away it is.
And that leads to the most compelling question of all: how do you actually map the Universe?
Universe 2D map: it is not a photograph taken from outside the cosmos
The first thing to clarify is simple but crucial. When we hear that astronomers have “mapped the Universe,” we must not imagine a photograph taken from some external vantage point outside the cosmos. Such a photograph is impossible. We are inside the Universe. Telescopes sit on Earth and observe the sky from a specific location in space. The new map is therefore a gigantic representation of what appears on the celestial sphere from our position.
In practice, astronomers have built a kind of cosmic chart. Instead of cities, mountains and oceans, it contains stars, galaxies, quasars and other sources of light. And the scale is almost impossible to imagine. The map contains nearly four billion astronomical objects and 5.6 trillion pixels. It was assembled by combining 263,407 exposures collected over 2,285 nights of observation. It is not a single photograph. It is a gigantic cosmic mosaic.
Universe 2D map: four billion celestial objects inside a single sky chart
If we could take a photograph of the sky and zoom in, we would find stars, then more stars, then galaxies, and then galaxies even farther away. In a normal photograph, many of these sources appear simply as tiny points of light. The new map gathers these details on a completely different scale. Objects are detected, measured and cataloged through extremely sophisticated computational processing. Each source is not just a dot arbitrarily drawn on a screen. Behind that dot are data about its position, brightness and the light observed across different spectral bands. This is what transforms a photograph into a scientific resource.
How astronomers built the largest Universe 2D map ever created
The answer is surprisingly concrete. Astronomers did not point a telescope at the sky and press a button. They collected an enormous number of images over many years and then stitched them together. The new version of the DESI Legacy Imaging Surveys was built by combining 263,407 exposures from three major ground‑based surveys: the Dark Energy Camera Legacy Survey (DECaLS), the Mayall z‑band Legacy Survey (MzLS), and the Beijing‑Arizona Sky Survey (BASS). To these observations, years of data from NASA’s WISE mission and other public datasets were added.
It is as if thousands of different photographs were transformed into one gigantic coherent image.
But this process contains a massive difficulty: the sky is never exactly the same.
The Sky Is Always Changing
When a telescope observes a region of the sky, it is not working in a perfect environment. The atmosphere changes. Air transparency changes. Turbulence changes. Sky brightness changes. Even the instrument’s conditions can vary. A photograph taken on a clear night is not necessarily identical to one taken under different conditions. This is why simply placing one image next to another is not enough. The data must be calibrated and corrected. Astronomers must determine which variations belong to the celestial objects and which are produced by the telescope, the atmosphere or the acquisition process. This is one of the reasons the map required enormous computational work.
From Telescope to Computer
The journey can be imagined like this: light becomes an image, the image becomes calibrated data, the data becomes detected objects, the objects become measurements, the measurements become catalogs, and the catalogs become a map. Each step matters. The telescope collects the light. The camera transforms it into digital data. The computer corrects and calibrates the images. Algorithms search for luminous sources. For each source, characteristics such as position, brightness and shape are determined. Finally, all this information is combined. On this scale, the process could never be done manually.
A Supercomputer Was Required
The volume of data is so enormous that a normal computer would be completely inadequate. To process the new map, astronomers used Perlmutter, the supercomputer at the National Energy Research Scientific Computing Center (NERSC) at Lawrence Berkeley National Laboratory. Preparing the new processing system required about a year of code development. The full image processing took roughly eight weeks, using around 100,000 GPU node‑hours and 15,000 CPU node‑hours. The final result contains more than 120 terabytes of scientific products. Behind what appears to us as a gigantic colored image lies a quantity of computation belonging more to high‑performance computing than traditional photography.
Why 5.6 Trillion Pixels?
A pixel is the smallest element of a digital image. 5.6 trillion pixels is a number almost impossible to visualize. The reason for such a vast pixel count is simple: astronomers want to preserve enormous amounts of information and distinguish extremely faint sources and tiny details. The map is not “large” only in physical dimensions. It is enormous in the amount of information it contains. A huge photograph of a white wall could have billions of pixels but contain almost no interesting information. Here, every portion of the sky may contain stars, galaxies, distant galaxies, transient objects and phenomena worthy of further study.
Why Call It a 2D Map?
If the Universe is three‑dimensional, why is this a two‑dimensional map? Because the map represents the apparent position of objects on the celestial sphere. Think of a normal geographic map. Earth is three‑dimensional, but a map can represent it on a flat sheet. The same happens here. The 2D map tells us: “In this direction of the sky, we see this object.” It can also tell us how bright it appears. But it does not automatically tell us how far away the object is. For that, another type of information is needed.
And this is where things become even more interesting.
The 2D Map Is Only the Beginning
The DESI Legacy Imaging Surveys were originally created to prepare the work of DESI, the Dark Energy Spectroscopic Instrument. The 2D map tells astronomers which objects exist in certain regions of the sky and where they appear. DESI can then select the most interesting objects and observe their light in far greater detail. This is how we move from simple position to depth. The difference is enormous. A 2D map says: “This galaxy appears here.” A 3D map says: “This galaxy appears here and is located at this distance.”
How Do You Measure the Distance of a Galaxy?
This is where one of the most important concepts in modern cosmology enters: redshift. The light emitted by a galaxy contains specific features. As the light travels through an expanding Universe, its wavelengths stretch. The spectral lines shift toward longer wavelengths. By measuring this shift, astronomers determine the galaxy’s redshift, indicated by the letter z. Combined with a cosmological model, redshift reveals distance and the cosmic epoch when the light was emitted. This is how a flat sky chart becomes a three‑dimensional representation.
Looking Far Means Looking Back in Time
Light does not arrive instantly. It travels at a finite speed. When we observe a galaxy billions of light‑years away, we are receiving the light it emitted billions of years ago. A 3D map therefore represents not only the positions of galaxies, but also different moments in cosmic history. DESI can observe the distribution of galaxies across roughly 11 billion years of cosmic time. It is difficult to find a better example of a scientific time machine.
In 2026 DESI Completed Its Great 3D Map
The release of the gigantic 2D map arrives at a particularly interesting moment. A few months earlier, in April 2026, DESI announced the completion of its planned five‑year survey. The result: more than 47 million galaxies and quasars observed, along with over 20 million nearby stars used to study the Milky Way. DESI described the result as the largest high‑resolution 3D map of the Universe ever created. This makes the new 2D map even more compelling. The two achievements are deeply connected. One shows where to look. The other determines how far away the objects are.
From Photograph to Cosmic Web
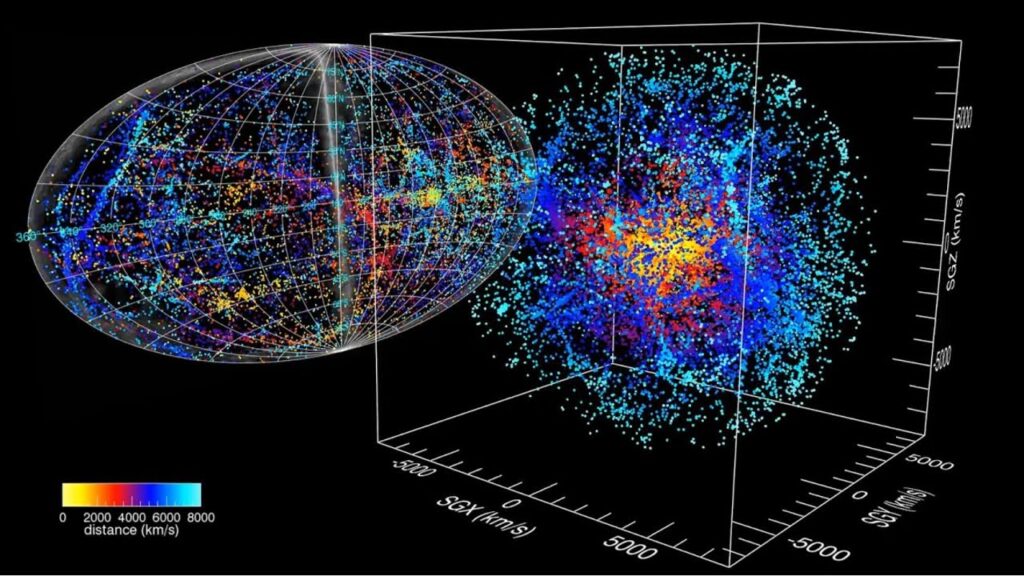
When the third dimension is added, something spectacular happens. Galaxies no longer appear as scattered points. Enormous structures emerge. Galaxies cluster together. They form groups and clusters. Between clusters stretch gigantic filaments. And between these structures lie regions of much lower density, the cosmic voids. The overall result is called the cosmic web. On enormous scales, matter is not distributed randomly. Gravity has shaped it over billions of years, building a vast structure of filaments and nodes. A 3D map reveals one of the largest physical structures known.
And What About Dark Matter?
The map becomes even more interesting when we remember that the galaxies we see do not represent all the matter in the Universe. Dark matter does not emit light and cannot be photographed directly. Its presence is inferred from gravitational effects. Dark matter played a fundamental role in forming cosmic structure. The distribution of galaxies therefore provides indirect information about the invisible matter. The map is not only a chart of luminous objects. It is also a tool for studying the gravitational structure of the Universe.
And Then There Is Dark Energy
The main reason DESI is building such a precise 3D map is even more ambitious. Scientists want to better understand the expansion of the Universe. Observations indicate that the expansion is accelerating. This phenomenon is described using the term dark energy. But its nature remains one of the greatest mysteries in physics. The galaxy map helps because it shows how cosmic structure has changed over time. By observing galaxies from different epochs, astronomers can reconstruct the history of expansion. This is one of DESI’s primary goals.
A Discovery That Could Challenge the Cosmological Model
Here the story becomes even more intriguing. Early DESI results suggest that the influence of dark energy might not be perfectly constant over time. The possibility is extremely important. In the standard cosmological model, dark energy is usually described as a cosmological constant. If its influence changes over time, our description of the Universe must be revised. But caution is essential. Astronomers have not declared the standard model wrong. These are statistical hints that require further verification. DESI will continue observations and expects more complete results using its first five years of data in 2027, with observations continuing through 2028.
Why This Map Will Matter for Future Telescopes
One of the most important aspects of the new map is that it was not created solely for DESI. It is a massive reference base for the entire astronomical community. Scientists can compare new observations with what was previously recorded. If an unusual object appears, they can check whether it was already present. If a star explodes as a supernova, they can compare its position with earlier images. If a galaxy produces a gravitational lensing effect, the map can help identify it. The survey can be used to search for rare and transient phenomena as well as for cosmology.
Artificial Intelligence Will Use This Map Too
Astronomical data is growing at an astonishing rate. Modern telescopes produce volumes of data that humans cannot analyze manually. Large cosmological catalogs are becoming valuable material for developing AI tools. The Legacy Surveys data can train systems capable of automatically recognizing and classifying enormous numbers of astronomical objects. The future of astronomy will increasingly be a combination of telescopes, large databases, supercomputers and artificial intelligence. The new map is one of the great data infrastructures on which this future will be built.
How Big Is This Achievement Really?
To understand the scale, consider the numbers: 5.6 trillion pixels. Nearly four billion astronomical objects. 263,407 exposures. 2,285 nights of observation. About 75% of the sky. Over 120 terabytes of scientific products. About a year to develop the processing code. About eight weeks of computation on the Perlmutter supercomputer. And all this to obtain a two‑dimensional representation of the sky. But that representation is only the first layer.
The Real Revolution Is the Transition from 2D to 3D
Perhaps the simplest way to understand the importance of the new map is to think of a city. A street map tells us where the streets are. But if we want to know the height of every building, we need a third dimension. The same happens with the Universe. The 2D map tells us where an object appears in the sky. Spectroscopy tells us how far away it is. The result is a 3D map. And when we add the fact that distant objects show us older epochs, we obtain something even more extraordinary: a three‑dimensional map of cosmic structure through time.
We Have Not Simply Drawn a Sky Chart
This is probably the most important point. The new map is not just a spectacular image. It is a gigantic scientific archive. It collects the light from billions of sources and transforms it into data that can be studied. It allows astronomers to identify galaxies, search for rare phenomena, compare different epochs, select objects for DESI, and contribute to research on dark matter and dark energy.
The Universe We See Is Only Part of the Universe
There is an important distinction. Saying we have “mapped the Universe” can easily create confusion. It does not mean we have photographed everything that exists. The new map covers about 75% of the observable sky in the relevant bands and contains billions of objects, but the Universe as a whole may be far larger than the part we can observe.
The map represents mostly what we can see through light. It does not show everything that exists. Dark matter does not appear as a luminous source. And we cannot observe regions beyond our cosmic horizon. It is more accurate to say that astronomers have built one of the largest maps of the observable cosmos accessible to their surveys. And that is already extraordinary.
A Map Built by Looking into the Past
There is a final irony that makes this discovery particularly fascinating. When we look at the new map, we feel as if we are seeing a photograph of the Universe. In reality, we are looking at a collection of photons that traveled for enormous periods before reaching us. Every distant galaxy is a page of cosmic history. The nearest galaxies show us a relatively recent Universe. The farthest show us a young Universe. When these pieces are assembled into a gigantic 3D map, we can follow how cosmic structure changed over billions of years.
The Largest Map Is Not the End of the Story
The release of the new 2D map is not the conclusion of cosmic cartography. It is a new beginning. DESI continues to observe the sky. New telescopes are coming online. The Vera C. Rubin Observatory and the Nancy Grace Roman Space Telescope will add new observations and new types of data in the coming years, which can be compared with this enormous reference map.
The maps will grow larger. The catalogs will contain more objects. Distances will be measured more precisely. Computers will analyze increasingly gigantic datasets. Perhaps in a few years, we will look at this map and see it as just another step in the history of cosmic mapping. But today it represents something extraordinary.
We Have Begun to Draw the Universe
For thousands of years, humanity has looked at the sky trying to recognize constellations, planets and stars. Today we are doing something entirely different. We are not simply looking at the sky. We are measuring it. We are transforming light into data, data into coordinates, and coordinates into maps. The new DESI Legacy Imaging Surveys map brings together 263,407 exposures, covers about 75% of the sky, contains 5.6 trillion pixels and nearly four billion celestial objects. And yet, for all its scale, it is still a two‑dimensional representation.
The next step is to give depth to those points—measure redshift, determine distances, reconstruct the positions of galaxies in space—and transform a gigantic sky chart into a three‑dimensional map of cosmic structure.
This is exactly what DESI is doing. In April 2026, the project completed its five‑year survey, observing more than 47 million galaxies and quasars and over 20 million stars. The most fascinating aspect is that this map does not simply tell us where galaxies are. It helps us understand how the Universe has changed. It reveals the cosmic web. It helps reconstruct the influence of dark matter. It allows us to study cosmic expansion. And it may even help determine whether dark energy is truly constant over time.
In the end, the great map of the Universe tells a very simple story. To understand where we are going, we must first learn to see where we come from. And to do that, astronomers have begun transforming the entire sky into a gigantic map. The result is one of the largest representations of the cosmos ever built by humanity.
As we push deeper into the structure of the Universe with the new Universe 2D map, it becomes impossible not to look back toward the earliest chapters of cosmic history. The first billion years of the Universe were a time of violent transformation, when the first stars ignited and the fog of primordial hydrogen began to clear. If you want to explore how those ancient processes shaped the very galaxies now visible in the DESI sky survey, you can continue the journey in Cosmic Dawn and Reionization: The First Billion Years of the Universe — a story that reveals how the earliest light carved the foundations of the cosmic web we map today.
The Universe 2D map shows us the large‑scale architecture of the cosmos, but new observations from JWST are revealing the fine structure hidden inside those filaments and voids. Dark matter scaffolding, early galaxies, and the invisible geometry of the cosmic web are now emerging with unprecedented clarity. To see how these discoveries complement the DESI mapping effort — and how they reshape our understanding of cosmic evolution — you can dive into Cosmology Updates 2026: Stunning New JWST Findings Transform Our View of the Cosmic Web, a look at the latest breakthroughs from the James Webb Space Telescope.
